SeraDeg: Help
Overview
Serum Degradation Analysis: what is it?
Biological samples undergoing long term cryopreservation are used in retrospective studies for biomarker identification.
Moreover, the handling of samples before freezing may affect their quality.
The quality of source material must be assessed before any study.
The peptidomic profile of a serum sample is characterized by some fibrinopeptide related signals,
mainly fibrinopeptide A (fpA) and its degradation products, generated during coagulation.
The high susceptibility of fpA to degradation, which was observed in a set of samples
(see a description of the samples and MS spectra data in the data page) both analysed within 2 hours from
collection and after storage of 18 months at -80°C, suggests its use as a quality indicator for cryopreserved serum samples.
When properly preserved, they should mainly contain whole and little degraded forms of fpA.
Samples exposed to a greater extent to chemico-physical injuries should show a greater presence of shorter peptides.
We defined a mass spectrometry based method and developed a software tool to assess the integrity level of serum samples by evaluating their fibrinopeptide contents.
The method also takes into account a serum sample of good quality, analysed with the same procedure, to be used as a reference.
Serum Degradation Analysis: how does it work?
The Serum Degradation Analysis software processes spectra to extract peak lists, which are then elaborated for noise reduction.
Finally, fpA related peaks are compared in order to compute their overall abundance and the percent contribution of each peptide.
Abundances are expressed as percent of the abundance of a reference spectrum.
If a reference spectrum is not provided by the user, the spectrum with the greatest overall abundance for fpA peptides is taken as the reference.
A quality score is assigned to spectra by taking into account both their overall fpA abundance and the ratio between abundances of more and less degraded forms.
Elaboration is optimized by processing spectra in parallel on a multicore virtual server.
User interface
One interface, three forms
Serum Degradation (SeraDeg) software comes to you with three input forms.
This is mainly due to the fact that your data need to be uploaded to the server and this can take some time, depending on its size and your internet connection.
So, in order to avoid uploading many times the same data, you are allowed to upload it once and make reference to the uploaded file any time you need.
Of course, we cannot store all your data forever. We presently allow storage for six months. This should be long enough to allow you all needed analyses.
However, if your data has a limited size and/or you only need to analyse it once or a few times, you can upload and analyse it in a single step.
Uploading your data for repeated analysis
In order to upload your data for later analyses, go to the Upload form.
In this form, you must specify: i) a reference name for the data, ii) your email address, iii) the file you want to upload. See figure 1.
This information is used to make your upload unique and retrievable. When you will analyse this data, you will have to specify these three information.
The name of your country is only requested for statistical purposes, and you can disregard it (but please, insert it in the form).
See a description of the parameters and of the format of the file in the section on "Data formats and parameters" of this manual.
 Figure 1: Upload form
Click to open enlarged in a new tab.
Starting an analysis on uploaded data
Once you have uploaded your data, you can analyse them by using the Analyse form.
In this form, you must specify the same key information defined while uploading the file: i) reference name, ii) email address, iii) file name.
Moreover, you must specify a job name, which will be a unique identifier for the analysis, along with the execution parameters. See figure 2.
The name of your country is only requested for statistical purposes, and you can disregard it (but please, insert it in the form).
See a description of the parameters and of the format of the file in the section on "Data formats and parameters" of this manual.
 Figure 2: Analyse form
Click to open enlarged in a new tab.
Uploading and analysing at once
Instead of uploading and analysing data in distinct steps, you can upload and analyse it at once by using the Upload and analyse at once form.
This is especially useful if you only want to analyse the data once (e.g., when you are confident on the parameters to use) or if the data file is small (hence the upload time is limited).
In this form, you must specify the job name, which will be a unique identifier for the analysis, the file to be uploaded and the execution parameters.
See figure 3.
Your email address is required for returning some essential information on the analysis by email. You can omit it.
The name of your country is only requested for statistical purposes, and you can disregard it (but please, insert it in the form).
See a description of the parameters and of the format of the file in the section on "Data formats and parameters" of this manual.
 Figure 3: Upload and analyse at once form
Click to open enlarged in a new tab.
Output
Summary results
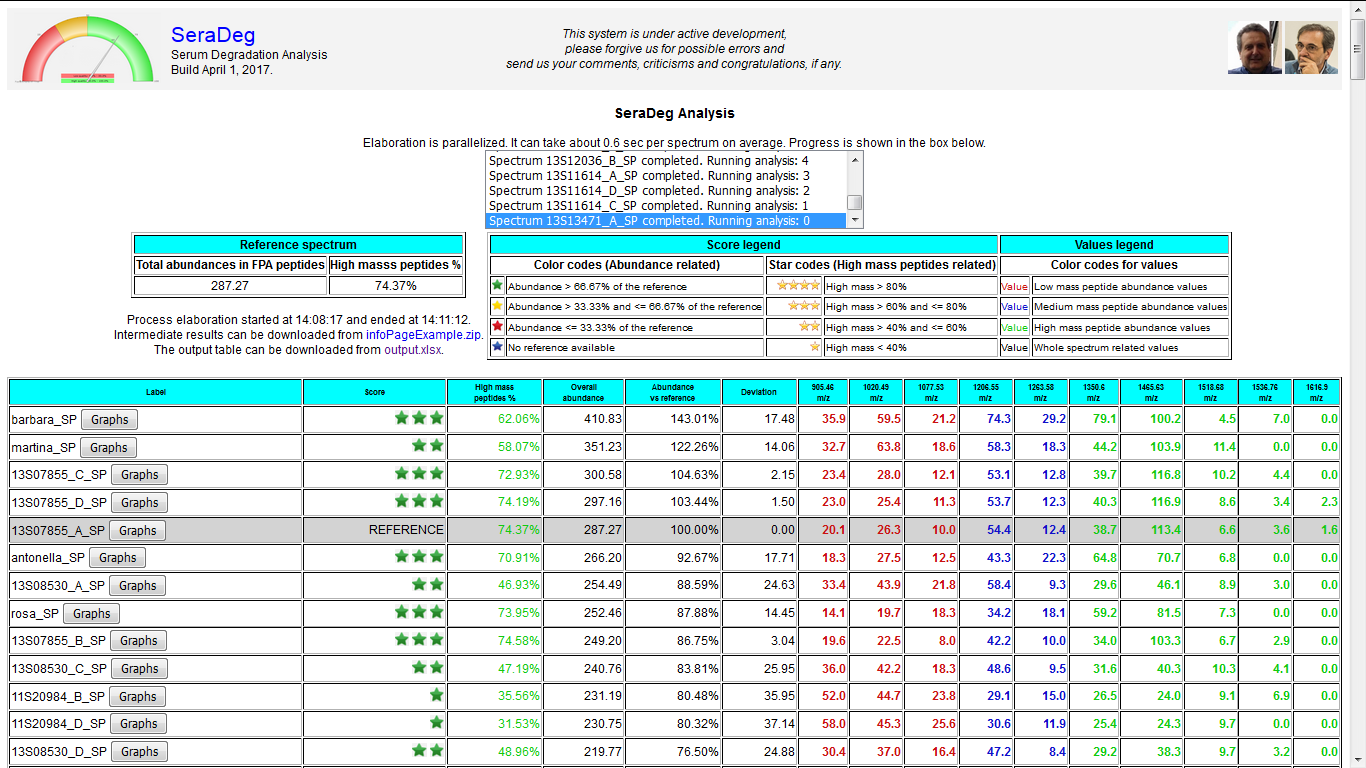
Ongoing elaboration
Although computation is parallelized, it may take a few minutes, depending on the number of spectra under analysis and the speed of the connection.
Presently, the analysis of one spectrum can take about 0.6 sec on average.
Progress is shown in a box by also reporting the analyse of which spectrum was completed or started and how many spectra are still under analysis.
At the end of the elaboration, this box remains visible. The user can scroll its contents, for information purposes.
See figure 4, upper part.
Summary of the analysis and legends
The summary of the analysis reports the following information: overall elaboration time, computed parameters for the reference spectrum,
and links for downloading both intermediate data and an MS Excel file with the results.
For the reference spectrum, the overall abundance of all fpA peptides and the percentage of high mass fpA peptides.
If the reference spectrum is not available or has not been identified (e.g. for a typing error in its name), this is highlighted.
The legend should be self-explanatory.
Just to provide one further example, a three star green score is assigned to a spectrum having
the sum of abundances of high mass (less degraded) fpA peptides greater than 60% and less or equal to 80%,
together with an overall abundance of all fpA peptides greater than two thirds (66.67%) of the overall abundance for the reference spectrum.
The legend also shows the colour codes for the peptide values shown in the rightmost columns of the results table.
Results
The table of results include the information for all spectra, one spectrum per line, ordered by decreasing overall abundance.
The same data can be downloaded in MS Excel format for later/further analysis.
The following information is reported:
- Spectrum label, together with a link to see the detailed graphical output
- Score, which must be interpreted at the light of the legend above
- High mass peptides percentage, which is computed by taking into account high and low mass peptides only
- Overall abundance of all fpA peptides for the given spectrum
- Overall abundance of all fpA peptides expressed in comparison to the overall abundance of the reference spectrum
- Deviation, which is the Euclidean distance between the spectrum and the reference computed by taking into account all fpA peptides
- Abundance of all fpA peptides in the given spectrum, in separate columns
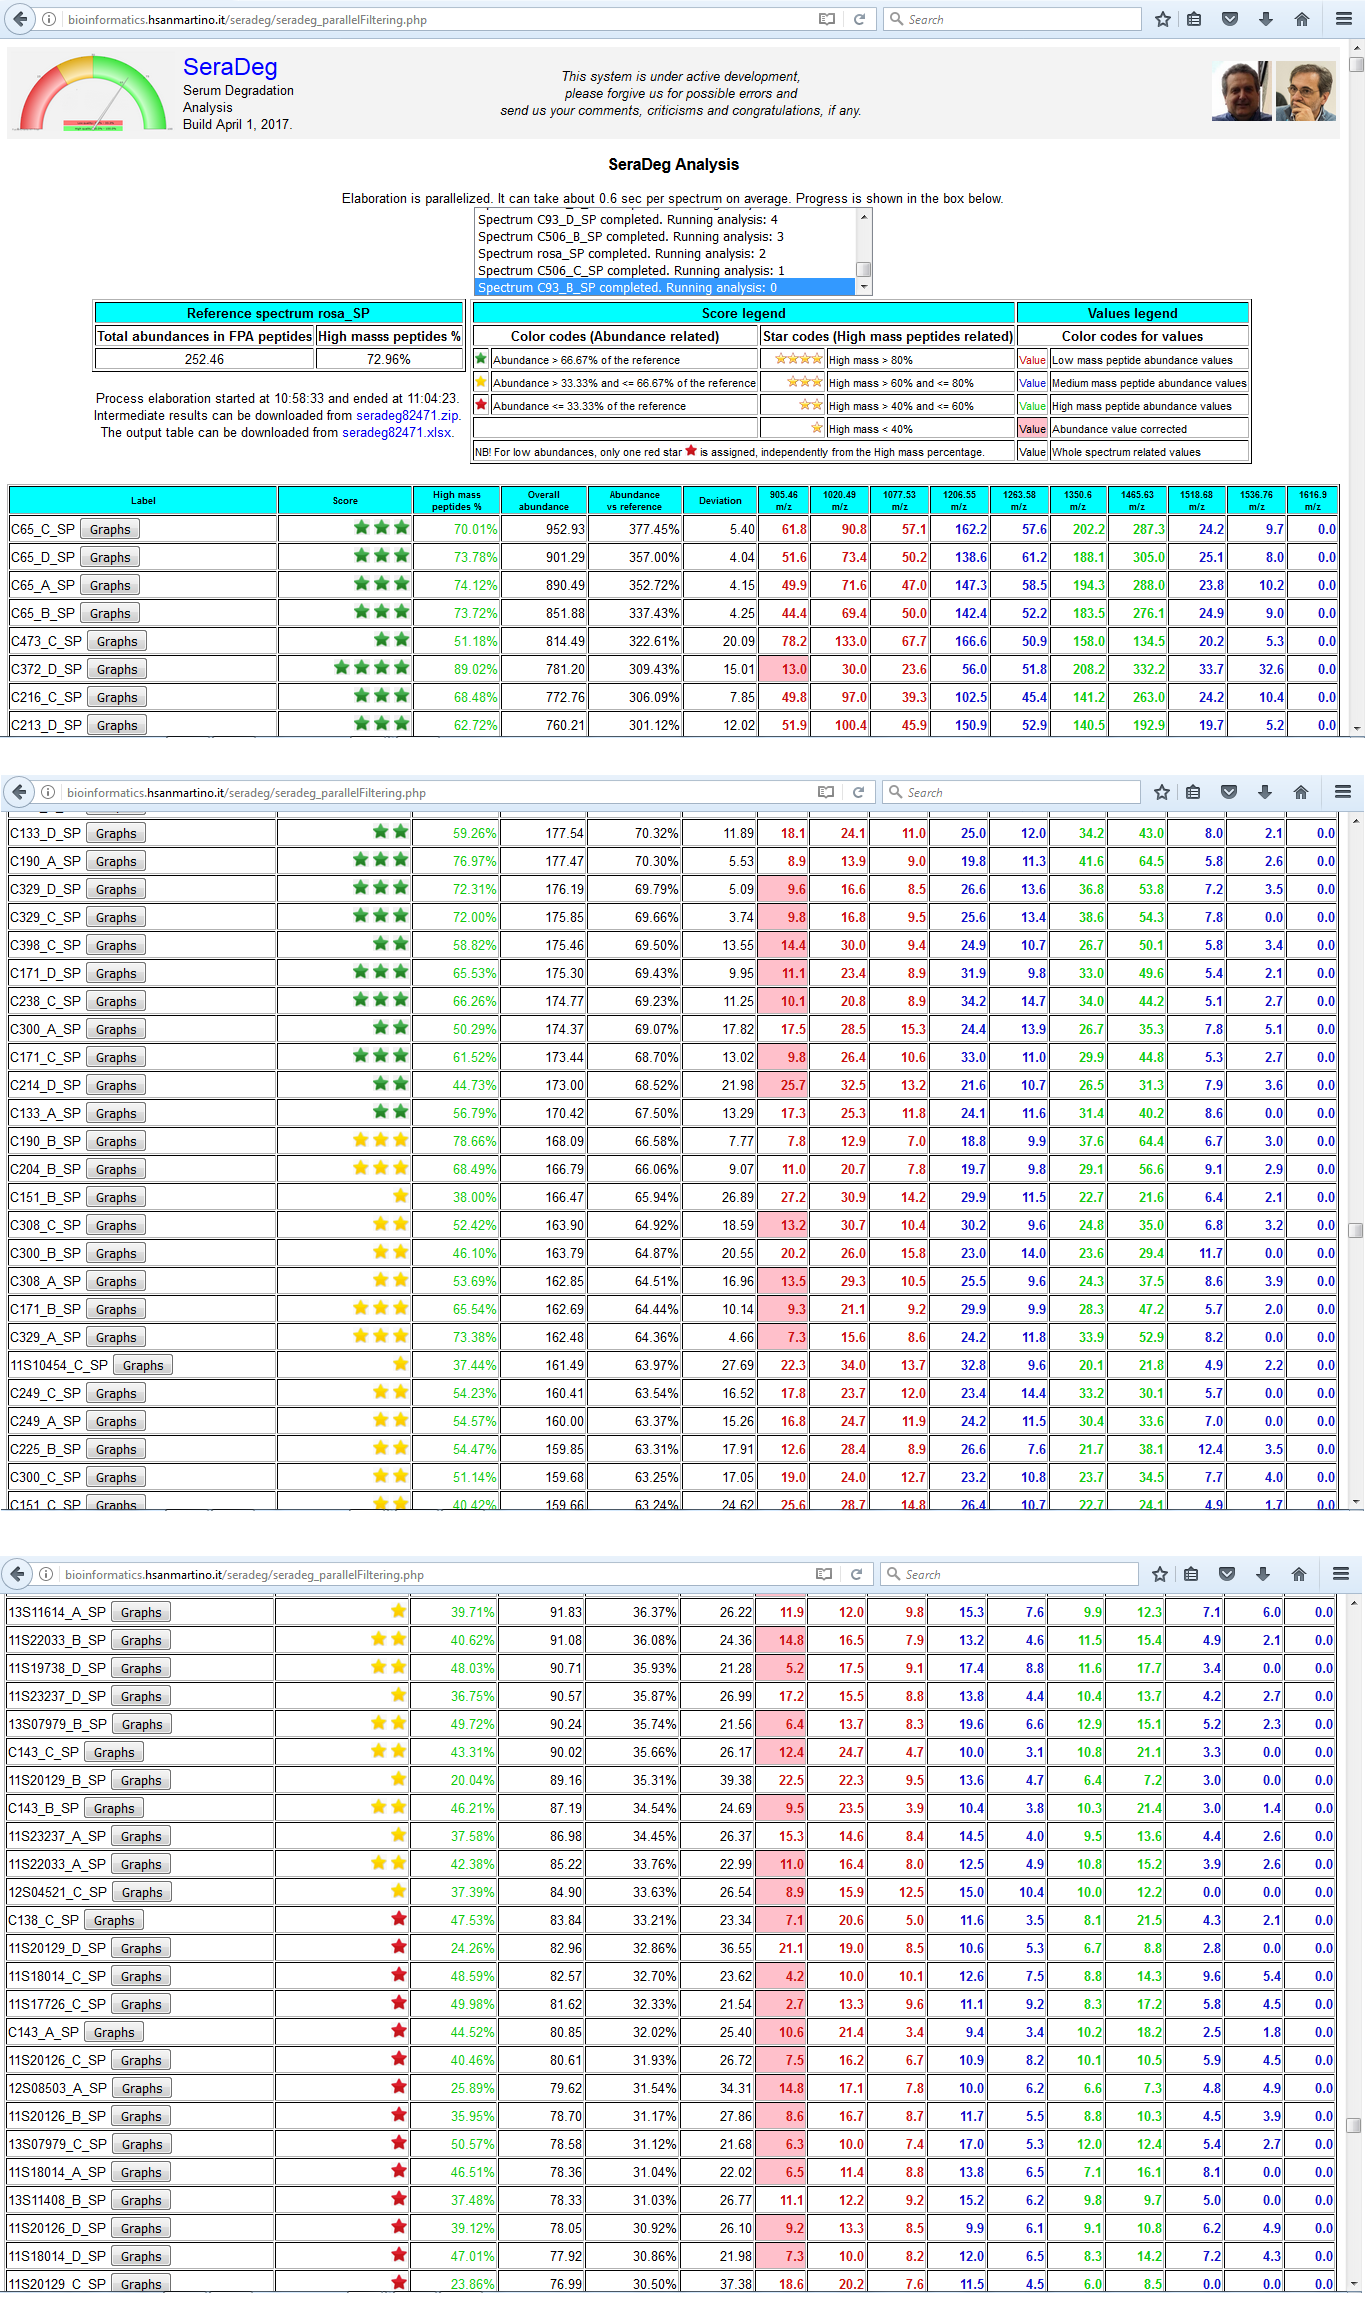 Figure N: Summary results of the analysis
The results of the analysis are reported in a table where each line makes reference to a distinct spectrum.
Lines are ordered by decreasing total fpA peptide abundance.
This figure only includes the upper part and two intermediate parts of the output.
In the upper part, a summary of the analysis and the table legends are reported. In the following sections, two distinct situations are shown.
In the first one, the lines where the quality score becomes orange are shown, while in the second section the passage from orange to red scores is shown.
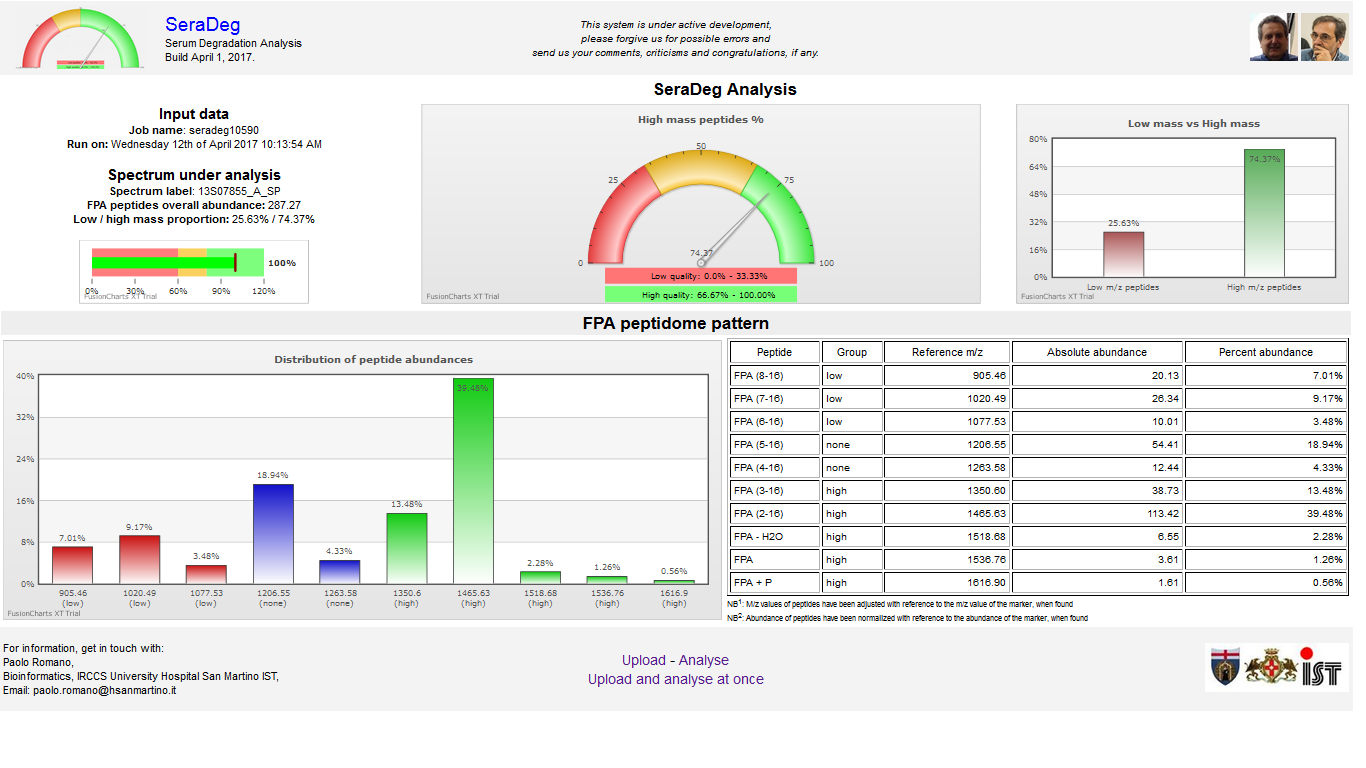
Detailed results
A detailed output can be obtained for each spectrum by clicking on the "Graph" button of the summary output page. See the figure below.
In this detailed output, a few graphs and tables are used to show the distribution of fpA peptides in the spectrum.
As shown in the following figure, the output is presented in two rows. In the upper row, from left to right, are reported:
- the job name, some essential data on the reference under analysis (label, overall abundance of fpA peptides and the ratio between low and high mass peptides),
and a bullet graph for the overall fpA abundance in the spectrum compared to the reference spectrum
(see Wikipedia for a definition of a bullet graph),
- a gauge graph representing the percent of high mass fpA peptides in the spectrum compared to the sum of both high and low mass peptides,
- a bar graph representing both low mass and high mass percentages.
In the lower row, from left to right, are shown:
- a bar graph with the distribution of fpA peptide abundances in percent, which includes all fpA related peptides,
- a table with the fpA peptide abundances, both absolute and percent.
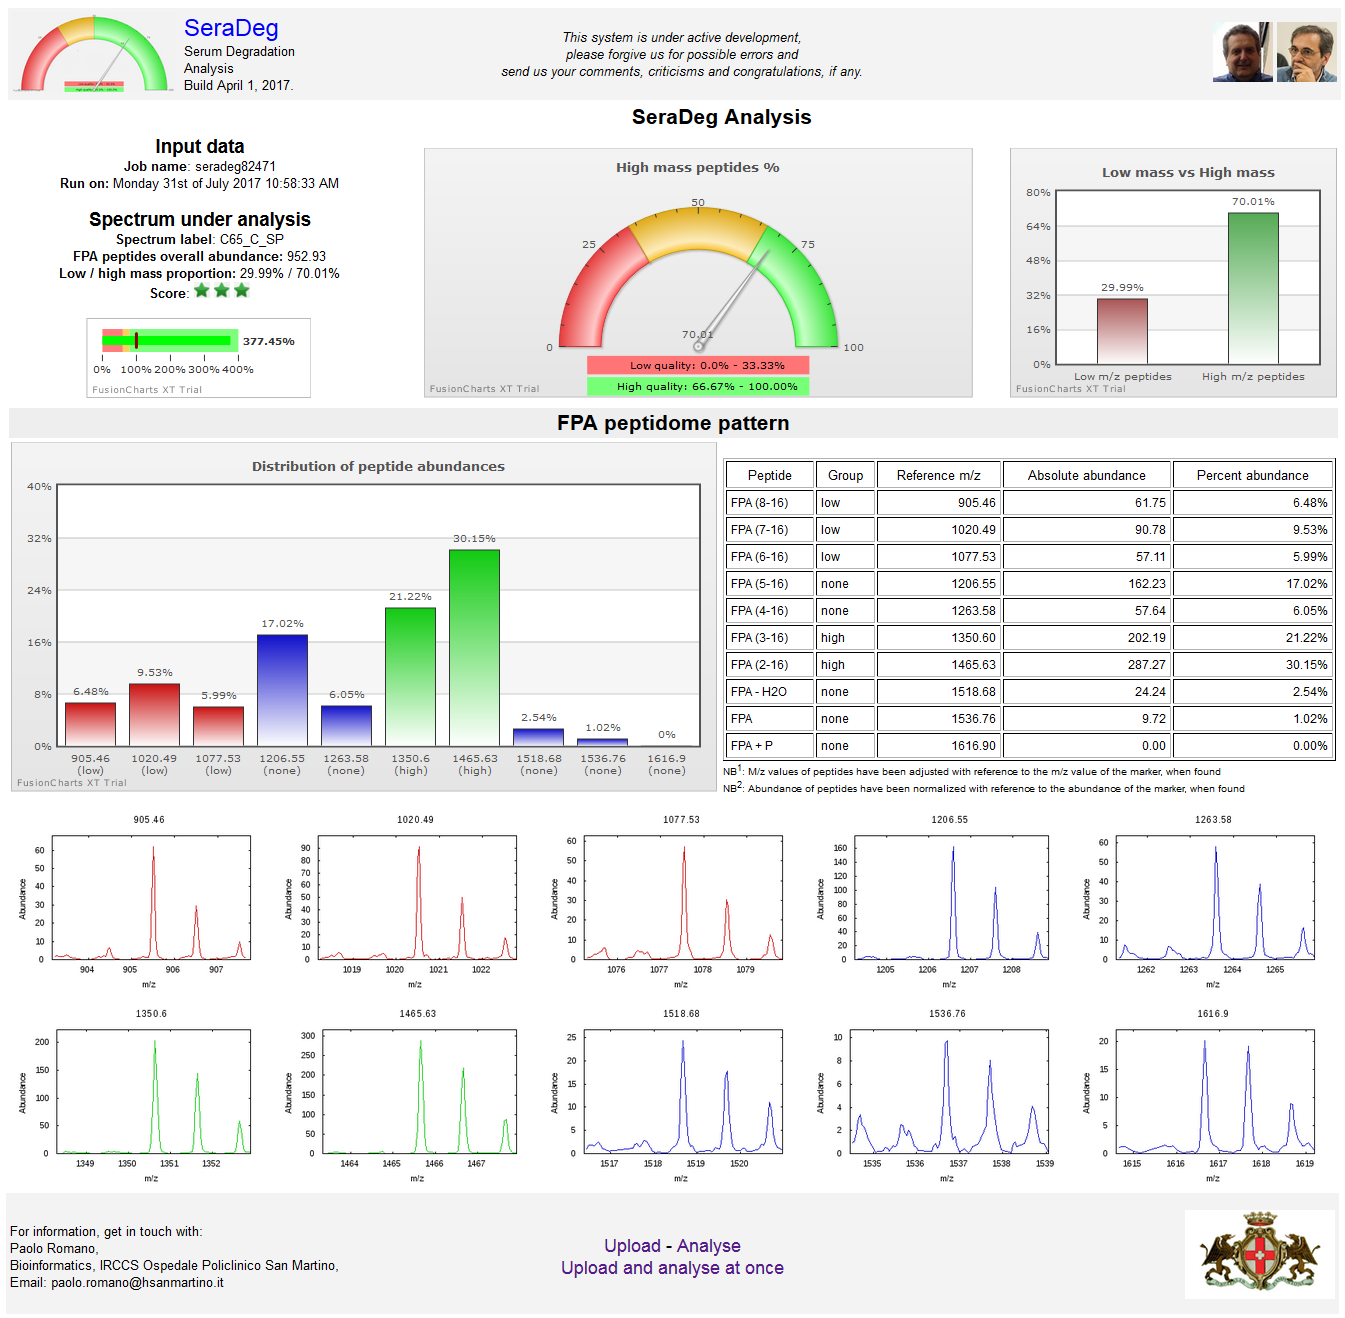 Figure N: Detailed results for a single spectrum
The results of the analysis are reported in a table where each line makes reference to a distinct spectrum.
Lines are ordered by decreasing total fpA peptide abundance.
This figure only includes the upper part and two intermediate parts of the output.
In the upper part, a summary of the analysis and the table legends are reported. In the following sections, two distinct situations are shown.
In the first one, the lines where the quality score becomes orange are shown, while in the second section the passage from orange to red scores is shown.
Information returned by email
When uploading an archive for later analysis
When an archive has been uploaded, the system returns to the user some essential information for the following analysis by email.
This email message should be conserved as a reference. It includes the key information that are requested to run an analysis on the uploaded data.
- The reference name for the upload.
- The email address of the user.
- The file name of the uploaded archive.
It also includes the deadline date for the execution of analysis, which is six months after the upload date.
After the deadline, the archive is removed from the system.
See here below and example email message.
From: paolo.romano@hsanmartino.it [mailto:paolo.romano@hsanmartino.it]
Sent: Wednesday, April 12, 2017 8:52 AM
To: Romano Paolo
Subject: SeraDeg upload results

The file testAllControls.zip has been uploaded.
It will remain available until Thursday 12 October 2017.
The following credentials have been recorded in association with this upload:

Reference name: seradeg_allControls.
User email: paolo.romano@hsanmartino.it.
At the end of an analysis
After the execution of an analysis, the system returns to the user by email the URLs for downloading both intermediate results and the final table.
Data format and parameters
Input data format
Spectra
Spectra are provided in a zip compressed archive of text files, each of which includes one distinct spectrum.
Text files include one pair of mass and abundance values, in this order, per line, separated by a space as in the following example.
The pairs must be ordered by increasing mass value.
One or more heading lines can be included, but will be ignored.
100.08097 2.49256
100.09243 14.5082
100.103 30.0608
100.11535 40.5548
......
Note that the number of digits after the dot can vary.
The name of the files including spectra can be freely assigned.
A label will be assigned to each spectrum by removing any trailing '.txt' text from the name of the file where it is included.
E.g., if the file name is 'C1234A.txt', the label will be 'C1234A'. If the file name is 'C1234_A.cvs', the label will be 'C1234_A.cvs' as well.
The name of the compressed archive won't be taken into account.
Further formats are under consideration and will be made available soon.
Output data format
Intermediate data
For each spectrum under analysis, 35 files with intermediate data are saved and made available for further analysis.
In the following list, "LABEL" is substituted by the actual label of the spectrum, determined as specified in the previous paragraph,
while MZ s substituted by the m/z value (only integer part) of one of the 10 0fpA peptides under consideration,
i.e. "905", "1020", "1077", "1206", "1263", "1350", "1465", "1518", "1536", "1616".
- LABEL_spectrum.txt: a copy of the spectrum in input.
- LABEL_sp_MZ.txt: the values of the spectrum in a range of -2.3 - +2.3 m/z around the MZ peptide (10 files, one per peptide).
- LABEL_peaks.txt: the list of peaks detected by the local maxima criterion for the whole spectrum.
- LABEL_selectedPeaks.txt: the list of peaks selected by the median filter for the whole spectrum.
- LABEL_peptide_values.txt: the abundances identified for the 10 fpA peptides in the spectrum.
- LABEL_k_peptide_values.txt: the abundances identified for peaks having exactly -1 m/z with respect to the 10 fpA peptides in the spectrum.
- LABEL_sp_MZ.png: the figure of the portion of the spectrum corresponding to the data in the file LABEL_sp_MZ.txt (10 files, one per peptide).
- LABEL_sp_MZ_th.png: a reduced figure (thumbnail) of LABEL_sp_MZ.png for visualization in the detailed output (10 files, one per peptide).
These files are included in a compressed ZIP archive named JOBNAME.zip, where JOBNAME is the job name assigned to the analysis by the user in the input form.
Parameters
| Name | Description | Encoding | Default | Context |
| Job name |
The job name is a label assigned to a given analysis. It is a reference label for results as well.
It is used both in the "Analysis" and the "Upload and analysis at once" forms. |
This parameter is not coded. It is free text, but it should only include letters and digits. |
The default value is a randomly generated text string starting with "seradeg" and including a random number of 5 digits (range: 00000 - 99999). |
Analyse - Upload and Analyse |
| Reference name |
The reference name is a label assigned to the file that is uploaded for later analysis.
It is defined in the "Upload" form and must be referenced in the "Analysis" form as a confirmation of the ownership of the uploaded file. |
This parameter is not coded. It is free text, but it should only include letters and digits. |
The default value is a randomly generated text string starting with "seradeg_ref" and including a random number of 5 digits (range: 00000 - 99999). |
Upload - Analyse |
| Email address |
The email address is an actual email address.
It must be specified in the "Upload" form and referenced in the "Analysis" form as a confirmation of the ownerships of the uploaded file.
It can also be specified in the "Upload and analyse at once" form, but it is not mandatory.
In any cases, if it is provided a summary message of the task performed (upload or analysis) is sent by email at the end of the elaboration. |
This parameter is not coded. It should be a properly formatted email address. |
There is no default value. |
Upload - Analyse - Upload and Analyse |
| Country |
The country of origin of the user. It is only used for statistical purposes. It can be omitted, but users are invited to add it. |
This parameter is not coded. It is free text and should include the full name of the country. |
There is no default value. |
Upload - Analyse - Upload and Analyse |
| File name |
The file name is the actual name of the file where spectra are included.
In the "Upload" and the "Upload and analyse at once" forms, the file must be selected by browsing the local hard disk and the file name is added by the browser.
In the "Analyse" form, the file name must be specified by the user in a free text input field.
Only the file name must be specified: avoid adding paths or folder names. |
This parameter is not coded. It must be the name of the ZIP compressed archive including all spectra. |
There is no default value. |
Upload - Analyse - Upload and Analyse |
| Reference spectrum |
The name of the reference spectrum, which is derived from a fresh serum of good quality, if available.
The reference spectrum must be included in the compressed archive under analysis.
If the reference spectrum is specified, then the overall abundance of fpA peptides for all other spectra is expressed as a percent of its overall abundance.
Moreover, a "deviation" measure from the distribution of fpA peptides of the reference spectrum is computed for all the other spectra.
This "deviation" is the Euclidean distance between the distribution of fpA peptides of the reference spectrum and any other spectra.
See also a description of the deviation score.
If the reference spectrum is missing or not found, the two scores above are not computed
and the quality score of the spectra is only determined by the ratio between high and low mass fpA peptide abundances. |
This parameter is not coded. It should include the name of the file of the reference spectrum, without the ending '.txt' characters, if present. |
There is no default value. |
Analyse - Upload and Analyse |
| Half window size |
This parameter is used along with the following "Signal to noise ratio" for the selection of peaks in the spectra under analysis.
A full list of peaks is first determined by selecting all local maxima, i.e. values which are greater than both the previous and following ones.
On the full list of peaks, a median filter is applied to detect only the peaks above a given threshold.
This parameter determine the half size of the window on which the median filter is applied. |
This parameter is not coded. It must include an integer number. |
The default value is "30". |
Analyse - Upload and Analyse |
| Signal to noise ratio |
This parameter is used along with the previous "Half window size" for the selection of peaks in the spectra under analysis.
A full list of peaks is first determined by selecting all local maxima, i.e. values which are greater than both the previous and following ones.
On the full list of peaks, a median filter is applied to detect only the peaks above a given threshold.
This parameter makes reference to the threshold above which peaks are selected:
a value of 3.0 means that only peaks whose abundance is greater than three times the median value of abundances in the window are selected. |
This parameter is not coded. It must include a decimal number. |
The default value is "2.5". |
Analyse - Upload and Analyse |
| Marker availability |
In order to improve comparison between spectra, it may be useful to add a known molecule in a given quantity.
When the corresponding peak is detected, all other signals in the spectra can be normalized with reference to its abundance.
Moreover, a possible small shift in the m/z value can also be corrected.
The availability of a marker and its use in many acquisitions can support a semi-quantitative analysis. |
This parameter has two alternative values: "Yes" and "No". |
The default value is "No". |
Analyse - Upload and Analyse |
| Marker m/z value |
When a marker is available, its m/z value must be specified.
If the marker is missing (e.g., the Marker availability parameter is set to "No"), this parameter is ignored.
When this value is specified, but it is outside of the range for the spectrum under analysis, it is ignored.
Similarly, when a corresponding peak is not identified in a spectrum, this parameter is ignored. |
This parameter accepts numeric values and it should be included in the range of m/z values for all spectra under analysis. |
The default value is "1420.76". |
Analyse - Upload and Analyse |
|
For information, get in touch with:
Paolo Romano,
Mass Spectrometry and Proteomics,
IRCCS Ospedale Policlinico San Martino,
Email: paolo.romano@hsanmartino.it
|
If you use SeraDeg, please cite the following paper:
Romano P, Beitia San Vicente M, Profumo A.
A mass spectrometry based method and a software tool to assess degradation status of serum samples to be used in proteomics for biomarker discovery.
Journal of Proteomics. Volume 173, 2018, Pages 99-106.
PMID: 29242081; DOI: 10.1016/j.jprot.2017.12.004 |

|
|